![[Product Image]](images/prodimg.gif)
Image caption goes here.
Image caption goes here.
I.
General Description
…………………………………………………………………….
2
II.
To Operate
………………………………………………………………………………
2
III.
To Get the Results
………………………………………………………………………
2
V.
Details of
Operation……………………………………………………………………..
3
VI.
Care and Feeding
..…………………………………………………………………….
4
VII.
The Computed Characteristics
……………………………………………………….. 4
VIII.
Detection System ………………………………………………………………………
7
IX.
Technical Details
………………………………………………………………………..
10

The ILLUMINATION QUALITY (TM) meter:
Tomorrow's light-meter...eight "eyes"... instant analysis of
illumination... twenty computed characteristics...a complete microcomputer...
read-only memory... random-access memory... keypad control…Iiquid-crystal
display and printer output... interface to large computer... rechargeable
batteries... three days' normal use between charges... battery condition
readout... one to one-thousand dynamic range...two-year conditional warrantee
on parts and labor.
The
Illumination Quality meter (the IQ meter) is a sophisticated, eight-eyed light
meter embodying a full-fledged microcomputer and a large software memory to
perform its computations.
The
IQ meter sees, by looking directly at the lamplight, what you as an expert see
by looking into the room illuminated by that lamplight.
With
its eight detectors, the IQ meter can do what the most experienced and highly
trained human observer cannot do: sense all the characteristics of a certain
lamplight by merely looking at the lamplight.
The
human observer needs the usual complex colored scene illuminated by that
lamplight, to assess the many effects of the lamplight on the appearance of
the illuminated scene. We call "the many effects of the lamplight on the
appearance of the illuminated scene”, the characteristics of that
lamplight.
The
human observer can, for example, pronounce the color- attractiveness of the
illuminated scene as "good" or "fair" or "poor."
He can, by careful comparison of similar adjacent scenes illuminated
differently, decide which one of these excels the other in color-
attractiveness, if only by a bit. But two difficulties remain: (1) how to put
a numerical value - a number - on the color-attractiveness of a certain scene,
and (2) how to be sure that the "average person" will assess the
color-attractiveness in about the same way.
Much of the value of the new IQ meter resides in the provision of several
new scales of the kind alluded to in the preceding paragraph. These new scales
(1) are numerical, (2) are representative of assessments of lamplight quality
by "average persons”, and (3) are completely visually-based.
The
IQ meter measures - puts a NUMBER on - twenty important characteristics of the
lamplight.
You
can HOLD IN YOUR HAND the instrument which gives all these answers.
It
is simply a light-meter. All you do is push a button. But it measures 20
characteristics of the lighting, all the traditional ones, plus the important
ones.
The important ones are:
(These are strictly visual
characteristics of lamplight)
·
Brightness
·
Color-Attractiveness
·
Visibility
·
Color-Scheme-Stability
·
Brightness
per Footcandle
Additional important ones are:
.
·
Color-Preference
Index
·
Color-Gamut
·
Visibility
per Footcandle
·
Visible
watts per square meter
·
Violet
watts per square meter
·
Ultraviolet
watts per square meter
·
Visible
microwatts per lumen
·
Violet
microwatts per lumen
·
Ultraviolet
microwatts per lumen
·
Brightness
per UV microwatt per sq. meter
·
Visibility
per UV microwatt per sq. meter
The traditional ones, also measured, are:
·
Footcandles
·
Chromaticity
x,y
·
Color-Temperature
·
Color-Rendering
Index
Description: The Illumination Quality meter, or IQ meter for short, is a portable
device to sample the illumination in a particular area, and to compute and
display a large number of qualities of that illumination. The IQ meter's
ultra-sensitive Detector-Head consists of eight photodiodes each covered by a
different optical filter, so that each is responsive to a different portion of
the spectrum. Thus the signal from each diode represents the intensity of that
portion of the spectrum to which it is responsive. The photodiode-filter
combinations are arranged in an array and exposed to the illumination, which
it is desired to analyze.
Each
photodiode-filter combination generates a signal in response to its portion of
the incident light. Each signal is amplified by an operational amplifier, and
charges a capacitor. The analog voltage on the capacitor is converted to a
digit by an analog/digital converter. The eight digits, representing the eight
portions of the incoming light, are stored in the microcomputer memory.
Mathematical functions are stored in the read-only memory; upon inserting the
eight incoming digits into each of these functions, each function computes a
value of a particular characteristic of the incident illumination.
The revolutionary ILLUMINATION QUALITY meter measures the old-fashioned
qualities of illumination: footcandles, color-temperature, color, and
color-rendering index. More importantly, the IQ meter also measures the
visually-based qualities: color-attractiveness, color-scheme-stability,
perceived brightness and visibility. These scales are derived from judgments
by experienced observers assessing each quality under different kinds and
intensities of lamplight.
Put
the IQ meter in whatever illumination you wish to know more about, touch the
'read' button, and give it a second to sample the light through its eight
eyes. By that time it has memorized the eight inputs, and already computed the
many qualities of the illumination. Touch more buttons and call out the
illumination qualities one by one to the liquid crystal display, or print them
on an included printer.
The IQ meter puts numbers on both the hard-nosed
and the esthetic qualities of your lamplight or lighting installation, or one
by your competition. What makes it pleasing? What makes it successful? It
measures about all there is to know about illumination. It displays the
secrets of lamplight. The IQ meter substitutes for a group of friendly and
talented experts, which you don't always have at your elbow.
II.
TO OPERATE
1.
Turn the
switch on. The IQ meter display will say "ready”.
2.
Set the
IQ meter in the lamplight you wish to measure, at the location you wish to
measure it. The Detector-Head, at upper right of the top surface of the meter,
is the light-sensitive area. The eight "eyes" are under the white,
scattering layer. Avoid casting any shadow on the IQ meter.
3. Touch the "read" button (R). IQ meter display says "testing”. ("Touch" means touch lightly, but hard enough to activate the switch beneath the key.)
·
In a few
seconds the IQ meter will give an audible signal that it is finished looking
at the lamplight.
·
The
display will say "done testing," or will show one of the computed
characteristics of the lamplight.
·
All
twenty characteristics have now been computed.
·
To call
them out of memory:
Touch "C," and then "1," to get C1 = Color Attractiveness, for example. C1 is the call-code of Color Attractiveness. There are twenty call-codes in all. The computed value of C1 will appear on the display.
 V. TO UNDERSTAND THE RESULTS
·
Allow
yourself a comfortable learning period to become familiar with the useful
scales of units.
·
Each one
of the twenty computed characteristics of lamplight has a useful scale of
units.
·
By all
means take the IQ meter out and use it. But realize that the enormous amount
of information you now have at your fingertips needs a great deal of study -
by you - to get out of that information all of the usefulness packed into it.
·
A
computer disgorges more information than one can at first handle, or
assimilate. Uncomfortable feeling. But one can learn gradually to use the
power of the computer. At first you may feel you have "a bull by the
tail"; later, you will feel in complete command. The computer in the IQ
meter can do a hundred thousand calculations in one second. One can learn to
use this power. Pressing the button and letting the IQ meter observe the
illumination for a second or two, essentially 'takes a snapshot' of the
lighting conditions. Then, with all the necessary information stored in the
computer's memory, one can (at his leisure) ask for, one by one, the numbers
describing each of the separate qualities of the illumination which was
present at the time the button was pressed. At any one time, and in any given
illuminated place, some of these qualities are more important than others. So
do not feel pressed to learn immediately the role each of the twenty
characteristics plays in modern lamplight; on the other hand, beware of
falling into the sheepish habit of leaning on the old, time-worn and
unreliable characteristics just because they are somewhat familiar.
·
It is
almost impossible to harm the computer during normal operation. Touching wrong
buttons will do no harm. If the display shows something incomprehensible
(probably a procedure used during manufacture or calibration of the IQ meter)
simply turn the switch off, and then back on. This clears the IQ meter's
memory and returns it to the "ready" state. If one gets mixed up in
asking for all the available information from the IQ meter, it is only
necessary to start analysis over again; not to take the 'snapshot' again. Or,
one can take the snapshot over again if he wishes.
·
It is
very informative to choose two rooms side by side, preferably lighted by very
different kinds of lamps (for example, standard fluorescent lamps and
prime-color fluorescent lamps); then sample the illumination in one space,
leisurely determine its many qualities, whether good or bad. Now sample the
illumination in the other space and compare each quality with the
corresponding one in the first space. Make careful comparisons between what
you see, and what the IQ meter says you should be seeing.
·
Study the
meanings of each of the twenty computed characteristics (Section VII).
·
You may
find that, at first, you may wish to concentrate mostly on a few particular
characteristics, becoming thoroughly familiar with their units and scales.
·
A wise
choice, to begin, is "Brightness" and "Color-Attractive-
ness."
·
Note
carefully how the value of a certain computed characteristic corresponds to
what you yourself see.
·
Begin
immediately to build up a personal sense of, and confidence in, what the
computed characteristics mean, in terms of quality and quantity of lighting.
1.
To choose
a particular characteristic of the lamplight, to be read out immediately and
automatically after every reading: (a) Touch "*98,” (b) then the
call-code of the characteristic desired. This sets what will be the first
display.
2.
To print
on the printer whatever is displayed: Touch "#".
3.
To print
out all twenty of the computed characteristics to the printer: Touch
"*96".
4.
The IQ
meter "looks at" the illumination falling upon its Detector-Head for
only a few seconds after the read-button R is touched. That is, the eight eyes
are operational only during the read-period. In that short time, it has
gathered and stored all it needs to know. At any other time, whatever
illumination may be falling on the Detector-Head is ignored.
5.
Therefore,
carrying the IQ meter around will not change the characteristics
last-computed.
6.
When you
want to recheck a result, to analyze a new or different illumination, or a
different brightness of the same illumination, or the illumination in a
different location, simply put the IQ meter in the proper place and re-read,
(R). This changes the remembered values of the characteristics, so be sure you
have written down, or have a print-out of, or don't care about, the
last-computed characteristics. On the other hand, it is usually simple to
re-read a certain illumination, if the information has been lost.
7.
The
characteristics last computed are stored in memory, and remain there until R
is touched again, or the meter is turned off. A new reading wipes out the old
one.
·
A little
care and a little feeding of your IQ meter will give you years of useful
service from it.
·
Carefully
protect its Detector-Head. Its eight eyes, although they are rugged, need to
be treated like the sensitive instruments they are - like any eyes. Let
nothing but LIGHT impact the Detector-Head.
·
As for
the rest of the IQ meter, treat it like any valuable computer. Don't knock it.
Don't subject it to extremes of temperature or humidity. Don't leave it in the
sun. Don't leave it in the car. Protect it from dust and dirt. Turn it off
when not in use. Put it in the case when not in use. Bear in mind that
disassembly voids the warranty.
Feeding:
1.
To
display battery voltage: Touch "*91." It should be between 8 and 9 volts. If it is lower, charge
for an hour or more. Check it daily.
2.
To
connect charger: Plug charger into IQ meter, THEN into wall outlet.
3.
Do not
charge overnight. Do not over-charge.
4.
To
display "low-battery threshold" setting: Touch "*92." This
is the battery voltage below which, during operation, the IQ meter will
automatically complain of low-voltage. It should be set normally to about
"7.5." When the display shows "battery low," charge the IQ
meter when convenient.
5.
If
"battery low" is displayed, and you wish to take a few more
readings, reset the threshold below the present "battery volts"
reading. You may then make a few more readings before recharging.
6.
To enter
"low-battery threshold" setting: Touch "*90." Enter
"7.5," for example.
A. Introduction
The usual light-meter outputs a single number. Sometimes, but not always, that single number gives the user an accurate measure of how bright a space appears to the average person. Or how well one can see in the space. Or what camera exposure to use. The meaning of its scale of units must always be carefully and patiently learned. If the meter is a "footcandle meter," experience teaches the user this sort of thing: (1) a reading of 1 footcandle warns that some difficulty probably will be encountered in reading a newspaper; (2) a reading of 50 footcandles is likely to be comfortable; (3) a reading of 500 footcandles will sometimes seem too bright. Not much more than that can be inferred from reading a footcandle meter. The footcandle meter is a very inadequate stand-in for human vision, or for the human observer. Even so, its scale of units takes time to understand and use.
The footcandle-meter has a single eye, as does the light meter on
a camera. With a single eye, a light meter can distinguish lightness
and darkness - nothing more. What a single eye senses can be described
with a single dimension, like inches on a yardstick.
The IQ meter, on the other hand, has eight eyes. Eight independent inputs. The eight eyes are sensitive to different colors of light; that is, to different parts of the spectrum (Figure 1). (This feature of the IQ meter is described in detail in Section VIII.) The eight eyes respond to: Ultraviolet, violet, blue-violet, blue-green, green, yellow, orange-red, and deep red, respectively.
This means that the IQ meter can measure eight dimensions of lamplight.
Most of us cannot imagine what it means to measure, and then visualize, more
than three dimensions - length, width and height of an object, or hue,
saturation, and brightness of a light. So the remaining five dimensions sensed
by the IQ meter remain outside our ability to visualize.
However, what we can do is relate those eight dimensions of lamplight to
some complex characteristic of the lamplight, for example BRIGHTNESS, which we
can understand.
This is the second step - the computation step - performed by the IQ
meter.
1.
Computation.
It is important to grasp the fact that most types of lamplight are
mixtures of colored lights; in fact, most lamplights are mixtures of lights of
all colors, even though the lamplight usually appears white to the eye. It is
the composition of the lamplight, the varying amounts of these colored
lights that make up the lamplight, which is responsible for the great
differences we note from one lamplight to another.
Immerse the IQ meter in a certain lamplight we will call "lamplight
A.” Touch the read-button. It "looks at" lamplight A for a few
seconds. During this time, each eye accumulates an electric charge,
proportional to the intensity of that segment of the lamplight to which that
particular eye is sensitive. For example, the blue-violet- sensitive eye
accumulates a charge proportional to the amount of blue-violet light present
in lamplight A, and similarly for the other seven eyes. The electronics in the
IQ meter convert the eight electric charges to eight proportional numbers.
Suppose the resulting eight numbers, accumulated by the eight eyes, and
characteristic of a certain intensity of lamplight A, are:
UV V
BV BG
G Y
OR DR
___ ___
___ ___
___ ___
___ ___
(Lamplight A)
31
73 122
158 188
245 221
132
The IQ meter automatically commences to make a long, complex calculation
of each of the twenty characteristics of that certain intensity of lamplight
A. The calculation is guided by
the eight numbers 31, 73, 122, 158, 188, 245, 221, 132, which it accumulated
while looking at lamplight A. In perhaps a second, the twenty calculations are
finished, and stored in its memory.
Now touch C1 (Color-Attractiveness). Out comes the number 613 to the
display. As you will learn, a Color-Attractiveness of 613 is reasonably good.
Now
repeat the entire process with the IQ meter immersed in a certain intensity of
lamplight B, resulting in:
UV V
BV BG
G Y
OR DR
___ ___
___ ___
___ ___
___ ___
(Lamplight B)
20
51 102
141 194
169 251
158
This time, each eye has accumulated a little different number. The
blue-violet-content (and each of the seven other "contents") of
lamplight B is at least a little different from that of lamplight A. All the
calculations are redone. Upon touching C1, out comes the number 842, a value
of Color-Attractiveness representing a lamp-light which is very good indeed.
The
IQ meter has transformed the eight measured dimensions of the lamplight into a
point on a simple scale (yardstick) of Color- Attractiveness which we can
understand (Figure 2).
It
does this by comparing its eight readings to a data-bank on many other
lamplights of widely-varying characteristics, all stored in its memory. It has
done this for all twenty lamplight characteristics, only one of which we have
as yet called for.
2.
The "Color-Attractiveness" Scale.
Let
us take for concreteness the scale of color-attractiveness, and examine the
means by which it was arrived at.
Sixty
or seventy real lamps were assembled, including most of the commercial
lamp-types on the market today (incandescent, fluorescent, and
high-intensity-discharge lamps) and in addition many experimental lamps with
properties both considerably superior to, and considerably worse than, those
of actual marketed lamps.
Five
identical enclosures were provided, with identical arrays of familiar colored
objects such as fruit, vegetables, meat, bread, butter, well-known examples of
commercial packaging, metallic objects. The geometry of the lighting was
carefully controlled to be constant despite changes in type of lamp.
Each
of the five enclosures was illuminated by a lamp with a
different spectral power distribution, i.e. by a different lamp-type. Brightness in each enclosure was adjusted to be approximately the same for all enclosures. All five enclosures were viewed simultaneously by the experienced human observer. The observer was required to rank the color-attractiveness of the arrays of objects each in its particular lamplight, and to assign each enclosure (Iamp type) a number from one to ten, the poorest being assigned the number one, and the most attractive coloration the number ten. One set of five lamp-types might be assigned the numbers: 3, 9, 10, 1, 2. Another set might be assigned the numbers: 8, 1, 3, 10, 5. Once the individual observers had made their assignments, two or more observers were asked to rank the five lamplights by consensus.
Next, three of the lamp-types were changed, always leaving two lamps from
the previous session, but randomized in position. The observations and ranking
were carried out as before, and the process repeated until all lamp-types had
been compared in groups of five.
The assessments of the single observers were remarkably alike. Consensus
was in most cases easy to agree upon. It was therefore apparent that the
"average person" is well defined, as regards his criteria for
assessing attractiveness of coloration of an illuminated scene.
The averaged magnitude-estimations were interleaved (the reason for
having two lamp-types common to sets of five in successive sessions). The
result was a scale, in which each lamp- type was assigned a certain rank, and
in which the scale-distance between adjacent lamps was not constant; i.e. the
scale-distance between types ranked 63 and 64 would probably be different from
the distance between types ranked 42 and 43. To the worst lamplight was
assigned "color-attractiveness = 1" and to the best,
"color-attractiveness = 1000." Most future lamps will undoubtedly
fall in the range of color-attractiveness of 1 to 1000. Hopefully a lamp of
the future will exceed a value of 1000 (which will introduce no problem,
either to the IQ meter or to conceptualization by the user), and also
hopefully no commercial lamp will require a negative value.**
"Color-attractiveness," arrived at in the above manner,
fulfills the three criteria: it is numerical, it represents the "average
person," and it is completely visually based.
3.
Other Scales.
"Color-scheme-stability" was arrived at in essentially the same
manner. Instead of foods, etc, identical arrays of fabrics were used, with the
obvious criterion of degree of upset of the color-scheme with change in
lamp-type.
The
scale of "Brightness Units" was found in a conceptually somewhat
simpler manner. Only two adjacent, identically furnished enclosures, each with
a different lamp-type, were used. Since neither quality nor trueness nor
preferredness of coloration was the criterion, but rather the perceived
brightness of the scene, the nature of the colored objects in the
identical scenes was presumed to be irrelevant. The footcandle-level in both
enclosures was initially set to 100. Then the brighter enclosure was dimmed
until the perceived brightness in each enclosure was pronounced the same. At
that point, the footcandle levels were again read and their ratio taken. For
each enclosure (lamp-type) a relative perceived-brightness-per-footcandle
value (B/FC) was thus obtained. For the yellow illumination of the
"Gold" fluorescent lamp, perceived-brightness-per-footcandle was
arbitrarily set at "1.00,” and the values for all other lamp-types
related to that. As examples, the B/FC values for a few familiar commercial
lamplights are given in the Table below:
Table I
|
Lamplight |
B/FC |
|
Warm White
fluorescent |
0.9 |
|
Cool White
fluorescent |
1.0 |
|
Daylight
fluorescent |
1.1 |
|
North light |
1.4 |
Knowing the B/FC values for all of the lamps, one has only to multiply
the measured footcandle values by the appropriate value of B/FC to obtain the
correct number of "Brightness Units."
The scale of "Visibility Units" was found in the above manner.
However, the brighter enclosure was dimmed not to equal bright- ness, but to
equal "visibility." This criterion is a little harder to define than
"brightness." It involves the ability to see the elements of a
scene clearly. In many cases, for example, the observer dimmed the one
enclosure much farther than he would have, had the criterion been "equal
brightness." It points up the fact that "brightness," although
a more useful unit than "footcandle level" with which to correlate
the ability to see well, yields to the concept of "visibility."
Picture
oneself in a boat on a lake on a calm morning, in a thin, sunlit fog: there
may be a great deal of brightness, but one is able to see very little: the
"visibility" is low.
In
everyday human visual experience, it is necessary to distinguish between, and
to do the best we can to measure, "bright- ness" and
"visibility."
In
the experiments being described, consensus was arrived at in the matter of
equality of visibility, although considerably more roughly than in the case of
color-attractiveness. Then, a value of visibility-units-per-footcandle was
arrived at for each lamp. As before, for the yellow illumination of the
"Gold" fluorescent lamp, visibility-per-footcandle was arbitrarily
set at "1.00,” and the values for all other lamp-types related to that.
Knowing the V/FC values for all of the lamps, one has only to multiply the
measured footcandle values by the appropriate value of V/FC to obtain the
correct number of "Visibility Units."
These
new visual scales are the subjects of continuing research, for they must be
determined with increasing precision. Nevertheless, already their validity far
surpasses anything heretofore available for the quantitative assessment of
lighting quality.
1.
The FOOTCANDLE.
The
footcandle is an illuminance of one lumen per square foot incident upon a
surface. One manner of defining the "lumen": In one watt of pure
yellow-green light of wavelength 555 nm, there are 683 lumens. If that one
watt of light were to fall on one square foot of white paper, the resulting
683 footcandles would appear bright yellow-green to the normal observer
(average person).
The
IQ meter reads footcandles as does the footcandle meter, but with the
increased accuracy deriving from its eight eyes, rather than from the
footcandle meter's one eye. Number of lumens = number of watts x 683 (lumens
per watt for the spectral color 555 nm) x the luminous efficiency of the
light. Luminous efficiency is luminous flux/radiant flux. Radiant flux is the
integral of the spectral power distribution, in watts of light incident per
unit area; luminous flux is the integral of the spectral power distribution
weighted by the photopic spectral luminous efficiency function V-lambda,
variously called the 'luminosity function,' the 'visibility curve,' etc. The
foot-candle meter 'has one eye'; its sensitivity is defined by the photopic
spectral luminous efficiency function V-lambda. Footlambert: an equivalent
footcandle; one lumen per square foot will be reflected from a perfectly
white, perfectly diffusing surface upon which one footcandle (one lumen per
square foot) is falling. A surface is said to have a luminance of one
footlambert if it is emitting one lumen per square foot.
The
user of this manual is advised to take great care to distinguish carefully
between perceived brightness, and either the lumen, the footcandle, or
the footlambert. None of these latter units can substitute for what is
normally called "brightness," and untold confusion and distress have
resulted over the last sixty years from the attempt. The footcandle does not correlate well to
what people see as 'bright.'
To
compute footcandle level, inputs from the IQ meter's eight eyes are properly
weighted according to the prescribed photopic relative luminous efficiency
function V-lambda, and the footcandle level incident on the detector-head is
accurately computed.
2.
The BRIGHTNESS UNIT.
The brightness unit is contrasted to the footcandle by visual experiment.
Many types of experiments require a trained observer with normal vision to
adjust two observed lights, or illuminated spaces, so that their brightness is
perceived to be the same.*
Once the observer pronounces the lights to be equally bright, the
footcandle (or footlambert) level is then measured, and the ratio B/L of
perceived brightness per unit of illuminance, or luminance, is determined.
Over the years, thousands of data of this type have been amassed; it has been
found that (1) observers with normal color vision agree adequately well on B/L
for a given light, and (2) B/L varies a great deal among lights of different
color or at least of different spectral power distribution. For our purposes,
in relation to the IQ meter, 'normal' yellow light, such as incandescence
through a yellow filter (yellow traffic light) is taken to have a
brightness-unit- per-footcandle or brightness-unit-per-footlambert ratio of
1.00.
Many
published results on a large number of illuminants of varying spectral power
distribution contribute to the function, stored in the IQ meter's memory, by
which brightness units are computed from the eight inputs. Chapanis and
Halsey** measured B/L for several hundred colored lights; they showed that
pure blue light has about ten times the brightness units per footcandle as
does normal yellow light, and pure green light and pure red light have about
twice the brightness units per footcandle as does yellow light. More
interesting still, light of the same color may have quite different
brightness-per-lumen depending upon its spectral power distribution; this is a
natural consequence of the three independent, and spectrally different, inputs
of the human visual system.
3.
BRIGHTNESS-PER-FOOTCANDLE.
Brightness-per-footcandle was determined, as described
above, for a large number of types of lamplight. It is simply the quotient of
computed brightness units and computed footcandles, for any illumination
sampled and computed by the IQ meter. Example: For 5000K filtered
incandescence, brightness-per-footcandle will appear on the IQ meter readout
as 1.3; that is, such illumination provides 30% more brightness units than it
does footcandles. Alternatively stated, 100 footcandles of that illuminant
provide the same perceived brightness as do 130 footcandles of normal yellow
light (for which B/FC = 1.00).
4.
The VISIBILITY UNIT.
The
visibility unit is also compared to the footcandle by visual experiment in
exactly the same manner as is the brightness unit. Here, rather than setting
to equal perceived brightness, the observer adjusts the light level in two
illuminated spaces so that he can see equally well, equally clearly. As
mentioned above, the visual characteristics of illumination here called
Brightness and Visibility are not at all the same. A room can seem full of
light, and yet one may not be able to see particularly well. Visual
experiments on visibility units are ongoing; results collected so far are
incorporated in the visibility function, stored in the IQ meter's memory, by
which visibility units are computed from the eight inputs.
5.
VISIBILITY-PER-FOOTCANDLE.
Visibility-per-footcandle
was determined, as described above, for a large number of types of lamplight.
It is the quotient of computed visibility units and computed footcandles.
Example: For the Cool White Deluxe fluorescent lamp, visibility-per-footcandle
will appear on the IQ meter readout as 2.4; that is, such illumination
provides 2.4 times as many visibility units as it does footcandles.
Alternatively stated, 10 footcandles of Cool White Deluxe illumination will
provide the same visibility as will 24 footcandles of yellow light such as
that from the 'gold' fluorescent lamp.
6,7,8. VISIBLE MILLIWATTS PER SQUARE METER, VIOLET MILLIWATTS PER SQUARE METER, ULTRAVIOLET MILLIWATTS PER SQUARE METER.
The approximate wavelength bands which are scanned by the IQ meter for
visible, violet, and ultraviolet content of the illumination are shown in
Figure 1. For example, 100 footcandles of light from an incandescent lamp
carries with it about 3.5 visible watts per square meter, 110 milliwatts of
violet light, and about 20 milliwatts per square meter of ultraviolet, if the
light-source is an unshielded quartz-tungsten incandescent lamp. Common
household bulbs will emit a smaller proportion of ultraviolet radiation.
Bear
in mind that lamplight may contain radiation outside the range of wavelength
covered by the IQ meter. For example, lamplight from the incandescent lamp
contains a great deal of infra-red radiation, at longer wavelengths beyond the
deep-red. Such radiation plays no part in the visual processes of interest to
us, and therefore the IQ meter has not been equipped to detect it.
9,10,11.
VISIBLE MICROWATTS PER LUMEN, VIOLET MICROWATTS PER LUMEN, ULTRAVIOLET MICRO-
WATTS PER LUMEN.
In a certain lamplight, once the visible watts per square meter and the footcandle level are measured, the quotient (times a constant) yields the visible microwatts per lumen; similarly for violet and ultraviolet "content" of a lumen of that lamplight. For the museum conservator, for example, the measurement of ultraviolet microwatts per lumen relates to the desired balance between the opposing requirements of (1) visibility to the observer of a precious article, and (2) its decomposition by incident light. Example: Stan-dard Cool White fluorescent light contains 60 microwatts of ultra-violet per lumen, while clear mercury HID contains 680 and one variety of 5000K filtered incandescence only 11.
12,13. BRIGHTNESS UNITS/UV MILLIWATT/ SQUARE METER, VISIBILITY UNITS/UV MILLIWATT/ SQUARE METER.
In a certain lamplight, once the brightness units and the ultraviolet
milliwatts per square meter are measured, the quotient yields the number of
brightness units per ultraviolet milliwatt per square meter. These are also
units of intense interest to the museum curator, as are visibility units per
ultraviolet microwatt per square meter of museum area, for example. Examples:
clear mercury HID supplies 0.3 visibility units per ultraviolet milliwatt per
square meter, Cool White fluorescent 1.2, and the 5000K filtered tungsten
incan- descent light supplies 2.1 units.
5000K
prime-color fluorescent lamplight supplies about 30 units, both because
ultraviolet content is lower and because visibility per footcandle is higher.
14. CHROMATICITY.
Chromaticity x and yare coordinates on a "color map" (Figure 3) called the 1931 CIE x,y chromaticity diagram. Coordinates x and y are computed by the IQ meter for the incident lamplight. As examples: Lamplight from the ordinary incandescent bulb has approximately the chromaticity x = 0.448 and y = 0.408. That of the standard Cool White fluorescent lamp is about x = 0.367, Y = 0.384. That of the Gold fluorescent lamp is about x = 0.517, Y = 0.479. The chromaticity of a lamplight will not actually indicate its apparent color; recall that an incandescent lamp inside a home, but observed from outside in average daylight, appears very yellow; but after dark from inside the home the same lamp appears quite white. Two types of illumination may of course have the same chromaticity but be very different in their other characteristics. For example, average daylight (6500K) and the standard Daylight fluorescent lamp both have a chromaticity of about x = 0.315, Y = 0.335, in the 'white' region of the diagram; their color-rendering characteristics are however quite different.
* A list of thirty-three published references, documenting the general
problem of visual determination of the relative brightness of different
lights, will be found in "Brightness Meter,” Journal of the
Illuminating Engineering Society, October 1980.
**A. Chapanis and R.M. Halsey, "Luminance of Equally Bright
Colors,” Journal of the Optical Society of America, Vol. 45, No.1, January
1955, p.1.
15.
COLOR-TEMPERATURE.
"Color-temperature"
is a convenient way of specifying the color of certain familiar and useful
lights. The white light from an overcast sky is one of these; it is one of a
unique series of natural lights, characteristic of incandescent glowing bodies
like the sun. At one end of this series of lights is the glow from a red-hot
poker in a blacksmith's shop. "Red-hot" corresponds to a temperature
of about 1000 Kelvins (1300 degrees Fahrenheit); the reddish color is
characteristic of an incandescent body at 1000 Kelvins. The in- candescent
tungsten filament in the household lightbulb, near 2800 Kelvins, glows with a
yellowish light. Sunlight has the color of a glowing body at about 5000
Kelvins, and blue sky has the color of a glowing body at some very high
temperature, say 100,000 Kelvins. Each temperature in Kelvins has associated
with it a color: red, yellow, white, blue-white, as temperature increases. So
we have a scale of "color temperatures"; the color temperature of
the sun is about 5000K because the color of its light when it reaches us is
that of an incandescent body at 5000K. The various phases of daylight are all
members of the series of "natural" lights, to each of which is
associated a color temperature. Light from a yellow sunset may have a color
temperature of 2000K, from a warm-looking cloud in the sunlight 4200K, from an
overcast sky 6500K. Note that there is nothing in the "warm-looking
cloud" that is anywhere near 4200K in actual temperature; it just shares
the color of an incandescent body which is glowing at that temperature. Light
from the commonest of fluorescent lamps has a 4200K color temperature, but the
lamp is hardly warm; light from the glowing embers in a fireplace has a
1000-2000K color temperature, and in that case the embers are really that hot.
The
curve within the color diagrams of Figures 3 and 4 is the locus of
chromaticities of the unique series of natural lights, which include phases of
daylight, and light from incandescent bodies. On this curve lie the
chromaticities (colors) with each of which is associated a color-temperature
in Kelvins.
What
the IQ meter actually calculates, as defined for the 1960 CIE u,v color
diagram (Figure 4), is known as the "correlated color temperature"
of the lamplight. Many lamplights are either a bit greener or a bit more
purple than the "natural" lights of the preceding paragraph, and so
do not really have a "color temperature.”
Because the unit is a useful one, although very approximate, correlated
color temperature is commonly specified for lamplights. It is the color
closest to the color of one of the natural lights. Because the
definition of "closest to" depends upon the particular color-diagram
used (and there are many in use for different purposes), the specification of
"correlated color temperature" is, for many types of lamplight,
rather sloppy. Choice of another 'official' color diagram (there are difficult
problems with the present choice - or with any choice - of color diagram) is a
possibility that is currently being considered. A change would make
significant shifts in the assigned correlated color temperature of any
lamplight differing from the natural series. Correlated color temperature of
the sodium lamp is about 2000K; the Warm White fluorescent lamp is about
3000K; 'Cool White' about 4200K; sunlight about 5000K; overcast sky about
6500K.
16.
COLOR-RENDERING INDEX.
Color-rendering
index is a measure of the similarity of color- rendering of a lamplight to
that of a reference phase of daylight closest to it in correlated color
temperature. The CIE defines eight test-colors by their spectral reflectance
curves. The eight chromaticities of these test-colors, as rendered by the
lamplight, are plotted in the u,v color diagram (Figure 5). The eight
chromaticities as rendered by the proper reference illuminant (which we can
take as a phase of daylight closest in color to that of the illuminant) are
also plotted. If the rendered chromaticities by reference and test illuminants exactly coincide, CRI = 100. If they do not,
i.e. if some or all of the test-colors are shifted by the test illuminant, the
average color-shift is computed, and the CRI reduced. CRI = 50 for the
standard Warm White fluorescent lamp (rather poor color-rendering), and can
even go negative for illuminants like low-pressure sodium. Two of the main
problems with CRI are: (1) If CRI is appreciably less than 100, there is no
way of guessing whether coloration is pleasant and acceptable, or unpleasant
and unacceptable. As one example, CRI = 60 for both the metal-halide HID lamp
and for the prime-color HID lamp; the colors of fruit, vegetables,
complexions, etc., appear pale and washed-out under the former lamp, and
colorful and vibrant under the latter lamp. (2) CRI of all reference
illuminants is, by definition, 100; but color-rendering by blue sky is very
different from that by the light from a yellow sunset, although for both CRI =
100, and both are prescribed reference illuminants.
17.
COLOR-GAMUT.
Color-gamut is simply the area on the u,v color diagram enclosed by the eight-sided figure (Figure 5) formed by the chromaticities of the eight test-objects as rendered by the test illuminant. Normalized to 100 for average 6500K daylight. The larger the gamut, the more saturated all colors will tend to appear. CG = 60 for the standard Cool White fluorescent lamp, 100 (as large as that for daylight) for the Cool White prime-color fluorescent lamp. See "Color-Discrimination Index," Journal of the Optical Society of America, February, 1972.
18.
COLOR-PREFERENCE INDEX.
Computed somewhat similarly to the CRI, except that the target, or ideal, chromaticities of the test-objects are not those as rendered by some reference illuminant, but rather those which the normal observer wishes to see. As prescribed by D. B. Judd of NBS in 1967, based on a collection of results of visual experiments on choice of colors for familiar objects. The computed CPI of an illuminant agrees well with the ranking of that illuminant as to acceptability of the coloration it gives to a scene. For average daylight, CPI = 100. Pure prime-Color illumination reaches a CPI of 120 or so. For deluxe fluorescent lamps CPI ranges 80-100. For standard fluorescent lamps, CPI is 50-70; for clear mercury HID, about zero; lower for the sodium lamps. See Deane B. Judd, "A Flattery Index for Artificial IIluminants," Illuminating Engineering, Volume 62, page 593, October, 1967; and "Customer Acceptance of the Color-Rendering of Illumination," Lighting Design and Application, March, 1982.
19.
COLOR-ATTRACTIVENESS.
A visual scale arrived at by side-by-side comparison of coloration given to identical arrays of familiar objects by sixty widely varying illuminants. The illuminants were compared four or five at a time, and the results interleaved to form a continuous scale running from one to about 1000 arbitrary units. Examples: For the incandescent lamp, CA = 823; Cool White Deluxe fluorescent 680; standard Cool White 430; clear mercury HID 60.
20.
COLOR-SCHEME STABILITY.
The interior designer chooses his color-scheme in excellent quality illumination. He then hopes his color scheme survives a change of lamplight. A visual scale was arrived at in the same way as for color-attractiveness, using color-schemes of fabrics as test- arrays. Visual experiments on color-scheme stability are ongoing; results collected so far are incorporated in the color scheme-stability function, stored in the IQ meter's memory, by which CSS units are computed from the eight inputs. CSS = 700 for the incandescent lamp and 450 for the standard Cool White fluorescent lamp. See "The Design of Safety Colors," Journal of the Illuminating Engineering Society of North America, January, 1977, for related discussion.
Of
the illumination falling on the IQ meter, the wavelength region from 250 nm in
the ultraviolet to 680 nm in the
deep-red is analyzed by the IQ meter (Figure 1). Of the eight eyes, or
detectors, one is sensitive to the ultraviolet region, one is sensitive to the
violet region, and the remaining six detectors cover six precisely defined
regions of the easily-visible region of the spectrum as follows: blue-violet,
blue-green, green, yellow, orange-red, and deep-red (Figure 1).
Note
that the familiar primaries - blue, green, and red - are not appropriate
divisions of the spectrum where human vision is concerned. Nor where the IQ
meter, whose objective is to substitute for the human visual system, is
concerned.
Figure 1. The spectral responses of the IQ meter. Top curve: The spectral power distribution of sunlight. Watts per nanometer wavelength interval (the power of sunlight in a narrow vertical slice) versus wavelength in nanometers. Middle curves: The spectral responses of each of the eight "eyes" of the IQ meter. No.1 is the special ultraviolet-sensitive detector; nos. 2 -8 are sensitive in precisely-defined bands in the visible region of the spectrum. Bottom: The designation of the eight bands by name.
Figure 2. The "yardstick" representing the Color-Attractiveness
scale. The computed values for lamplights "A" and "B". The
IQ meter transforms the hard-to-visualize eight measured dimensions of the
lamplight, to a single dimension (for example Color-Attractiveness) which is
easy to understand.
Figure 3. Definition of "color-diagram," "chromaticity," and "color-temperature." The 1931 CIE x,y color-diagram: Periphery is the locus of chromaticities x and y of the spectral colors (pure, brilliantly-colored lights corresponding to narrow vertical slices of Figure 1); a few wavelengths are labeled in nanometers. Inner curve: Locus of chromaticities of natural lights of different color-temperature; i.e., of color corresponding to that of an incandescent glowing body at some Kelvin temperature. The perceived color of a body at 1OOOK (one thousand Kelvin) is red, 2000K is orange, 3000K is yellowish, and at higher temperatures the perceived color becomes white and then blue-white; the observer is presumed to be adapted to average daylight.
Figure 4. The 1960 CIE u,v color-diagram; a simple transformation of the diagram of Figure 3.
Figure 5. The 1960
CIE u,v color-diagram; a small area in the neighborhood of the chromaticity of
average 6500K daylight D65 (spot at the center of the pattern). Also shown are
the eight chromaticities of the CIE test-colors as they are rendered by the
6500K daylight. A species of lamplight of the same color, and of the same
chromaticity (spot at the center of the pattern), would probably render the
same eight test-colors rather differently. Often, but fortunately not always,
artificial lighting renders colors paler than does daylight, so their rendered
chromaticities would generally fall inside the daylight-pattern.
Color-Rendering Index would be less, and Color-Gamut would be smaller (see
text).
Sunlight, with the spectral power distribution of Figure 1, is composed of power distributed quite evenly at all wavelengths through the region to which the IQ meter is sensitive. The exception is the "short-ultraviolet" region, where the atmosphere subtracts much of the short-ultraviolet radiation from the sunlight. Artificial illumination of some kinds does, however, contain power at short- ultraviolet wavelengths. There are a number of important reasons why short-ultraviolet radiation should be monitored, and in many applications guarded against. For example: (1) It can cause painful, although temporary, damage to the eyes. (2) It will fade and decompose many materials such as paint, dye, ink, cloth, paper.
Number-one detector responds to the band of wavelengths called the
ultraviolet region, including both "short-ultraviolet" and
"long-ultraviolet" sectors. Because of this sensitivity, the IQ
meter responds to tanning wavelengths, in both short-ultraviolet and
long- ultraviolet regions of the spectrum. It is thus capable of monitoring
these important radiations. The problem is that it is still unknown which
wavelengths, and which optimum combination of wave- lengths, cause tanning, or
tanning with "sunburning.” It is suggested that the user regard as very
tentative any prescription of ultraviolet radiation for any purpose whatever.
The IQ meter is best suited to monitor ultraviolet radiation from the point of
view of "the less the better:” Some exceedingly useful measures of
ultraviolet-content of illumination are output by the IQ meter. One example is
"microwatts of ultraviolet per visible lumen." These measures are to
be used primarily by those who, for a host of reasons, wish to control, and
usually minimize, the ultraviolet content of illumination.
Number-two
detector is sensitive to the violet-content of illumination. Power at
"violet" wavelengths is more or less midway between the
often-harmful fading and decomposing wavelengths of ultra-violet radiation,
and the important visible wavelengths upon which we depend to see. Violet
light is very much more visible than traditional handed-down thinking
acknowledges, and than the internationally adopted standards specify. The
violet-content of light quite powerfully influences the perceived color of the
light. Violet light is also quite powerful as a fader and decomposer of
materials, although not as virulent as ultraviolet wavelengths. Materials
differ greatly, of course, in their susceptibility to damage by either
ultraviolet or violet light. The user of the IQ meter should, if that
possibility is of interest or concern to him, carefully document the
importance to his activities of both ultraviolet and violet light, separately.
Alternatively, in the course of time he can relate IQ meter readings in those
regions of the spectrum to his own observations on the effect of the
illumination containing the violet and ultraviolet radiation.
Violet-content
of light is a factor in IQ meter readings of "brightness" and
"visibility," for example, as well as in human perception of
"brightness" and "visibility." The footcandle-meter is
blind to violet light; human vision is definitely not. It follows that,
although the IQ meter reads "footcandles," because footcandles are a
traditional measure of amount of light, the user of the IQ meter should
immediately begin to re-educate himself, and cease to equate "footcandles"
with "brightness" or "visibility." The straight- forward
way to do this is simply by getting in the habit of comparing the user's own
visual assessment of the illuminated scene to the readings of the IQ meter;
most readings will correlate well, because they are properly visually based,
but "footcandle" readings can be very misleading indeed.
Detectors 3, 5, and 7 respond to the "prime-colors" of human
vision: blue-violet, green, and orange-red.
Detectors 4, 6, and 8 respond to the "anti-prime-colors,"
blue-green, yellow, and deep-red. The above is a carefully based and unique
division of the visual spectrum. It is due to this particular segmentation of
the spectrum (Figure 1) that the IQ meter yields a powerful analysis - in
close accord with visual assessment - with so few detectors. Shift the
responses one way or another and you lose the prime capability of the IQ
meter: its ability to substitute for the human visual system.
Each of the eight photodiodes (without its associated filter) is
sensitive to radiation in a broad range of wavelengths. Photodiodes vary
appreciably in their spectral sensitivity, from one diode to another, making
it unwise to assume that any two diodes are identical in their spectral
response. Stable filters are used, a different filter with each diode, to
restrict incoming light to the band desired for that diode. For example, the
proper filter admits only blue-green light to photodiode number four, a
different filter admits only deep-red light to photodiode number eight, etc.
Yet it is also unwise to depend on absolute reproducibility of, say,
blue-green- filter transmission from batch to batch of filter material, any
more than to assume that the photodiode under the blue-green filter of IQ
meter #9701 is identical in its response to the photodiode under the
blue-green filter of IQ meter #9702. So none of these assumptions is made.
Each IQ meter, together with its assigned detector-head, is calibrated
against a large number of samples of real lamplight of widely disparate
characteristics. The characteristics of each lamp light sample are determined
precisely by the Prime-Color, Inc. spectroradiometer. From the ensuing huge
amount of data, the memory of each IQ meter is filled with its own unique set
of factors. These factors tell it how it should respond, under any lamplight
whatever, when any of the twenty computed characteristics of that lamplight is
called for.
Since most artificial lamplight flickers twice each voltage-cycle (120
times per second), and the light output waveform of the lamp in adjacent
half-cycles is often not identical in shape, the incoming lamplight must be
sampled thoroughly throughout one or a small number of complete cycles, or
throughout a large number of cycles. For example, the sampling should be
carried out over a period of time rather exactly equal to N times 16,667
microseconds, if N is a small number. On the other hand, smoothing with RC
filters, or by other means, and sampling for a second or so is acceptable.
What will not suffice is to sample for very short periods of time, milli-
seconds or microseconds, even if the sampling takes place at the same point of
the voltage cycle.
Type: Light, compact, hand-held eight-eyed illumination com- puter-analyzer
(illumination quality meter) with digital readout of twenty computed
characteristics of lamplight, by liquid-crystal display and microprocessor;
multiple uses and interfacing.
Receptors:
High-sensitivity photodiodes (one GaAsP photodiode and seven silicon
photodiodes) filtered to detect eight closely-specified bands of radiation
covering the ultraviolet and visible regions of the spectrum, under
integrating flat opal diffuser.
Spectral
response: Individual photodiode-filter combinations engineered to respond to
ultraviolet out to 250 nm, violet, the three prime-colors (blue-violet, green,
and orange-red), and three anti- prime-colors (blue-green, yellow, and
deep-red).
Calibration:
Each individual IQ meter is calibrated against a number of actual lamps of
widely disparate spectral power distribution, and for each of which the values
of the twenty output functions are known.
Measured
characteristics: (See Table below)
Minimum
illumination required: Twenty milliwatts of white light per square meter, or
five milliwatts per square meter of colored light.
Allowable temperature range of operation: 10 to 120 degrees Fahrenheit
(-10 to 50 degrees Centigrade). Nickel-cadmium batteries should be kept above
freezing. Some drift of analog values and spectral responses at temperature
extremes.
Controls: Sixteen-key pad, main switch.
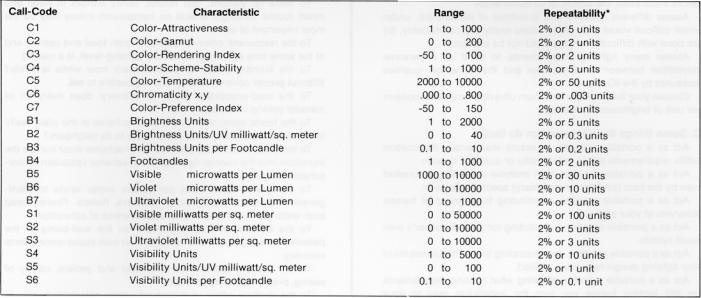
Measured Lamplight
Characteristics:
*Whichever is larger.
Display: LCD type, 16-digit, 5 x 7 matrix, decimal and units.
Audible signal: When finished reading.
Operating functions:
1. Print display on printer.
2. Print all twenty computed characteristics of lamplight.
3. Enter new baud rate.
4. Enter test-end instruction.
5. Dump eight raw values to serial port.
6. Display battery volts.
7. Enter low-battery threshold.
8. Display low-battery threshold.
Accessories: Printer, case.
Dimensions: 305 x 260 x 95 mm (12 x 10.25 x 3.75 inches)
Weight: About four pounds (1800 grams).
(Specifications subject to change without notice.)
X.
APPLICATIONS
A. Introduction
Illumination Quality and Quantity is best judged by consensus, using a
group of expert, unbiased, experienced human observers with normal color
vision. Given such a group of observers, one can expect to get a reliable
evaluation of any aspect of illumination. After all, "illumination"
has little meaning except as it relates to human activities, and as judged by
human observers.
Is
the office lit brightly enough for painstaking paperwork? Does the restaurant
illumination make food look appetizing? Does the concert hall enable a patron
to read his program and yet highlight the orchestra on the stage? Does the
lighting in the hospital room encourage the patient by benefitting his
appearance, to his own satisfaction and that of his visitors? Does the hotel
lobby lighting yield attractive coloration of guests and decor? Will the
draftsman in the proposed engineering complex be able to work long hours
without visual fatigue?
A group of expert observers, with lots of time and patience, can answer
these questions. The human visual system can make such judgements, and of
course helped formulate the questions in the first place. But such an
investment in man-hours is seldom possible.
Is
there a substitute for the group of human observers, a sort of "secondary
standard"? Partly. Consider the complete spectral power distribution of
the illumination, i.e. the composition of the lamplight, in one of the
situations above. A first-class spectroradiometer can determine the spectral
content of the lamplight. Once that is
accomplished, a first-class computer can evaluate the content of the
lamplight, and come up with ratings which partially answer many questions like
those above.
But you now own, and can hold in your hand, an instrument which can do
better even than that.
What was needed: (1) An optical device simpler than the spectro-radiometer,
(2) more sophistication in relating the results to what we actually see, and
(3) the same first-class computer.
The
Illumination Quality meter looks at the lamplight, but sees much of what you
see when you look at the illuminated scene. Among other things, the IQ meter
sees brightness, footcandles, attractiveness of coloration, color,
color-temperature, color-render- ing index, gamut of coloration, fading risks,
color-scheme stability, visibility. It can tell you how many brightness units
you are getting for every footcandle, and for every watt of light; how many
visible watts fall on a square meter of work surface. It will give you an idea
of how stable your color-schemes will be in a proposed illumination.
No longer is the user of commercial lamps more or less at the mercy of the lamp manufacturer. The user can now know exactly what his customers will enjoy about the lighting - and what they will find distasteful.
Among the important qualities of illumination, particularly arti- ficial
illumination as supplied by commercial lamplight, are:
1.
Brightness,
as perceived by the user.
2.
Coloration
of the scene
a.
as judged
by the trueness of the observed colors,
b.
as judged
by the pleasantness and satisfaction given
by the colors of the
surroundings
c. as
judged by how clearly colors are seen.
None of these three qualities of illumination has been adequately
measured by meters available to the user. The familiar footcandle meter can
differ by 100% or more from expert visual judgement of the brightness of a
scene, while no good measure at all of visibility was possible. The
Color-Rendering Index (CRI), which can be calculated with the use of a
full-scale computer, is an index of similarity of coloration to that afforded
by real phases of daylight; it fails to agree with the observer's assessment
of coloration of a scene in all three respects, trueness, pleasantness, and
clarity.
B. Some things the IQ meter can help you do:
Assess particularly pleasing and successful lighting installations, to
determine which qualities are important ones in those cases.
Assess
a problem installation, to determine what qualities are lacking.
Assess
potential customers' present lighting, to establish a basis on which to make
recommendations for improvement.
Assess a new lamp, independent of its environment, to predict, before
installation, the quality of its illumination.
Assess
different qualities and quantities of illumination, under which difficult visual
tasks (a) are done easily and comfortably, (b) are done with difficulty, or (c)
should not be attempted.
Assess
many lighting environments, to build up a personal correlation between what you
see and the numerical qualities measured by the IQ meter.
Choose
your lamplight for minimum ultraviolet and violet content per unit of brightness
or visibility.
C. Some things the IQ meter can do itself:
Act as a portable monitor, to assure that certain illumination fulfills
requirements either as to quality or quantity, or both.
Act
as a portable monitor, with analysis capability unequalled even by the best
(portable or stationary) spectroradiometer.
Act
as a portable monitor, substituting for a group of trained observers at your
elbow.
Act
as a portable monitor, substituting for your customer's own visual system.
Act
as a portable monitor, demonstrating that all requirements in your lighting
design have been fulfilled.
Act
as a portable monitor, showing what lighting requirements are still lacking
before you turn the installation over to your customer.
Put
numbers on the esthetic qualities of your lighting installation.
Determine which lamplight yields the most visibility per watt of
lighting power; how to save the most electrical-power cost; the most
energy, in kilowatt-hours or barrels of oil.
Give
you an indication of how rapidly your lamplight may be expected to fade your
furnishings.
Measure
practically everything there is to know about your illumination.
Make sophisticated measurements.
Analyze your illumination as it varies from room to room. Measure the
light from a proposed new lamp and show you
beforehand how it will perform in your installation.
Take
a reading in competitor's illuminated space.
Take
a reading of some particular lamp, or lamplight.
D. Some places to take your IQ meter:
To the kitchen: clarity and appearance of food during preparation need
monitoring.
To
the museum, or art gallery: are the precious artifacts adequately visible, but
minimally irradiated by harmful wavelengths?
To the factory: difficult visual tasks can be done with comfort and well
being, IF the lamplight is monitored and improved in quality.
To
the post office: sorting is the sort of visual task requiring exceptional
"seeing." (Using sodium lamps in post offices is a not- so-mild
insanity.)
To the bank: it has already been demonstrated that banking tasks can be
done in visual comfort, with half the electric power, if lamplight quality is
sufficiently high.
To
the mill: Aristotle found some little time ago that weavers need special care in
their illumination.
To
the buffet: in the home, it is sufficient if the guests find the repast
appetizingly colored and attractive; in the commercial restaurant or hotel, it
is a matter of economics that the paying diners find the color-rendering of the
food-array enticing.
To
the restaurant kitchen: crisp clarity of vision helps get the right ingredients
in the right bowls.
To
the diagnostic area: in the home, doctor's office, or hospital it is essential
that the lamplight render the patient's condition accurately.
To
the beauty parlor: make-up application, hair coloring, fingernail polish
application all require good color rendering and clarity. To the barbershop:
rendering of hair and complexions, as well
as good-seeing for the barber, are economic requirements. To the hotel or
motel bathroom: color rendering of the usual standard fluorescent lamp takes out
all the enthusiasm of a new day.
To
make-up stations, rest rooms, vanity mirrors in hotel and motel rooms: lamplight
effects on complexion colors may be the most important of all.
To
the restaurant: color-rendering of both food and patron, and at the same time
achieving a subdued lighting-level, is a real art.
To the laundry (home or professional): how white is white? Without proper
color-rendering, it is impossible to tell.
To
the food-processing plant, or cannery: does every bit of material belong in the
can?
To
the fabric store: what is the color-scheme in the plaid really like? How does a
fabric-color really relate to its neighbors?
To the (any) interior: the planned color-scheme must survive the
transition into the interior lighting. Color-scheme validation. Color- scheme
stability.
To
the greenhouse: Watts per square meter relate to plant- growth. Nurseries,
underground nurseries, florists. Florists need both watts per square meter and
attractiveness of coloration.
To
the hospital: the lighting bears on the well-being of the patients, the
appearance of their food; their own appearance affects recovery.
To
the dentist: appearance of dentist and patient, clarity of seeing, proper
matching of teeth.
To
the drafting office, architectural office: painstaking, minute detail demands
good seeing.
To
the studio: painters, portraitists need a steady lamplight, capable of
color-rendering as well as north light.
To
the parking lot: assuming that it is necessary for the patron to find his own
car, assessment of the color rendering and visibility in low-intensity lamplight
is called for.
To the auto showroom: much display takes place after dark; the car colors
must look very much the same the next morning in sunlight.
E. Some questions your IQ meter can answer:
Is
the office lit properly for difficult paper work?
Does
the office illumination allow maximum throughput of difficult visual tasks?
Does
the office illumination impede throughput of office work? Are you aware that it
is cheaper to install superb lighting, than to use poorer lighting, if it
reduces office-efficiency even a little.
Does
hospital room lighting encourage patient and visitor? Does the restaurant
lighting make food appetizing? Does the lighting allow accurate medical
diagnosis? Can the draftsman work long hours without fatigue?
Are
the concert hall and hotel lobby lighted optimally?
How do you light your space to get much more brightness than the
footcandle meter indicates?
How
will the new commercial lamp please your customer?
Does
the lamplight which surrounds you show off your complexion and clothes
attractively?
Is
the lamplight around you the proper warmness or coolness (the proper
color-temperature), to suit the activities there?
Does
the illumination in your store show off your merchandise in an attractive
manner?
Does
the illumination in your store show off the colors of your merchandise in a way
that will agree with how the customer sees those colors when he takes his
purchase somewhere else?
Does
the illumination in your store do all these things and still save you money on
your electric bill?
Does your illumination contain too much harmful violet and ultraviolet
radiation?
Will
your illumination fade your furnishings or your prized objects?
Does
your illumination afford good visibility?
Does
your illumination afford the best visibility for a given amount of fading (if
you are, for example, a museum curator, or have your own art collection)?
Does
your illumination brighten your space agreeably (quite aside from the footcandle
level)?
** The atrocious experimental lamp which merited assignment of "color- attractiveness = 1 " is, however, not much worse than the clear mercury lamp. Very possibly the color-attractiveness of the low-pressure-sodium lamp would have to be assigned a negative value, but of course relating color-attractiveness to the sodium lamp makes little sense.
| Description | SKU # | Price |
|---|---|---|
| option 1 | sku-1 | 100 |
| option 2 | sku-2 | 200 |
| option 3 | sku-3 | 300 |